Reports
Overview (web)
The Reports Tab is a vital section in the Hive, providing a detailed view of your account activities and trading performance. It includes multiple sub-tabs designed to help users track financial data, analyze trades, and prepare for compliance needs like taxes and audits. This section is essential for understanding and managing your financial health effectively.
- Ledger:- Displays all transactions, including deposits, withdrawals, and trade settlements, helping you monitor your fund flow efficiently.
- Trade Registry:- Lists the history of executed trades, offering a detailed view of your trading activities and patterns.
- Contract Note:- Provides official records of transactions, useful for compliance and audit purposes.
- P&L Report:- Summarizes realized profits and losses, giving a quick overview of trading performance.
- Tax P&L Report:- Presents profit and loss data tailored to tax requirements, simplifying tax filing.
- Global Report:- Offers a consolidated summary of key financial data, including trade summaries, account adjustments, and tax-related information, for a comprehensive view of account activity.
Ledger
The Ledger serves as a centralized summary of all financial transactions conducted through your trading account, allowing for efficient monitoring and detailed tracking of account activity. This feature is essential for tracking deposits, withdrawals, margins, and other financial entries. By selecting appropriate filters, users can generate detailed reports tailored to specific periods and trading segments.
Table with Filters & Input Options
- Based On:
- Voucher Date: Refers to the transaction date when the trade was executed.
- Effective Date: Denotes the date when the trade was settled (e.g., Equity Cash trades settle on a T+1 basis).
- Date Range: Users can define a start (From Date) and end date (To Date) to view transactions within a specific timeframe.
- Segment: Retain the default selection (i.e. TFSL):
- With Margin Checkbox: This checkbox allows users to choose whether to include margin debits and credits in the report. Selecting 'With Margin' will provide a breakdown that includes margin-related transactions, offering a complete financial view, including utilized margins. Opting for 'Without Margin' will display only core transactional details, excluding margin-related data, which can simplify the report for users focused solely on primary account movements.
Detailed Table Breakdown
The ledger table provides a structured and comprehensive view of all transactions, with each column serving a specific purpose:
- Voucher Date: Displays the date when a transaction was recorded. This helps users verify the dates of trades or account activities.
- Voucher Reference: A unique transaction ID generated for each record, enabling users to trace specific entries effortlessly.
- Exchange: Indicates the exchange where the transaction occurred, such as NSE for equities or NSEFO for futures and options, helping users differentiate trades by segment.
- Narration: A descriptive field providing insights into the nature of the transaction, such as "Trade Bill," "Margin for the day," “Margin reversal for the day,” “NSEFO bill,” “Payout,” or "Payin," adding context to each record.
- Debit: Reflects the amounts deducted from the trading account, including charges, withdrawals, or settlements pay-ins, helping users monitor all transactions including charges if any.
- Credit: Shows the amounts credited to the account, such as deposits, trade proceeds, or refunds, ensuring users can track inflows accurately.
- Balance: Displays the running account balance after each transaction, offering a clear picture of the financial position over time and assisting in reconciliation.
Trade Registry
Overview
The Trade Registry tab is a comprehensive tool for tracking the history of all trades conducted through your trading account. It provides a structured view of transactions in three modes: Date-wise Detail, Symbol-wise Detail, and Scrip-wise Summary. This tab is highly customizable, allowing users to filter transactions by exchange, symbol, and date range to retrieve specific trade histories. Additionally, it includes an innovative calendar heatmap visualization that enhances the user’s ability to identify trading activity trends at a glance.
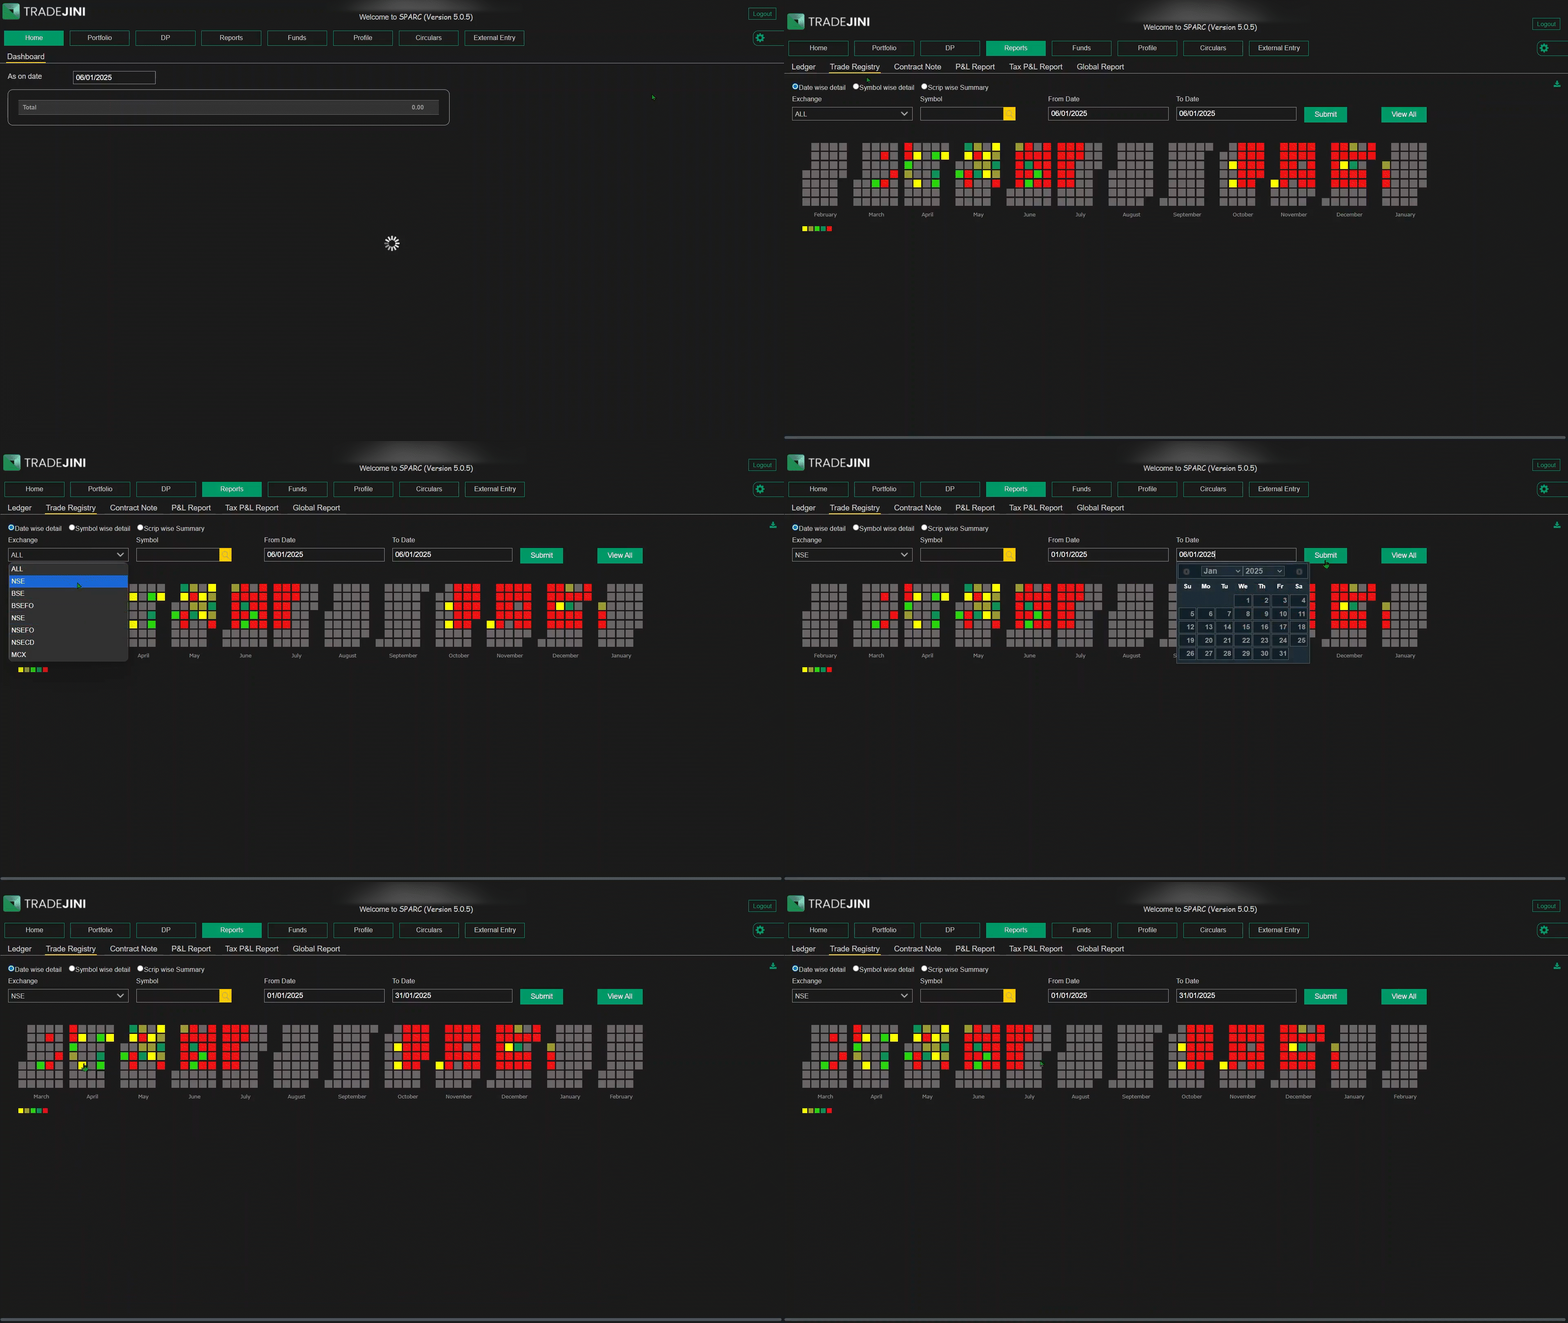
Calendar Heatmap Visualization
One of the standout features of the Trade Registry tab is the calendar heatmap, designed to provide a graphical representation of your trading activity. The heatmap utilizes a grid format, where each square represents a day of the year, and color coding indicates the level of activity:
- Bright Yellow: Less than 10 trades per day.
- Dull Yellow: 10 to 20 trades per day.
- Green: 20 to 30 trades per day.
- Blue: 30 to 40 trades per day.
- Red: More than 40 trades per day.
This visual aid allows traders to quickly assess their trading patterns over specific months or across the entire year. For example, users can easily spot periods of high-frequency trading or inactivity. Clicking on any specific day redirects the user to a detailed breakdown of trades conducted on that date, making the calendar heatmap both an informative and interactive tool.
Filtering Options
To refine the trade history displayed, users can apply the following filters:
- Date Range: Select the "From" and "To" dates to retrieve transaction data within a specified timeframe.
- Exchange: Choose from available options (e.g., NSE) to view trades conducted on a particular exchange.
- Symbol: Input a specific scrip to narrow down trade history for that symbol.
Modes of Viewing Trade History
The Trade Registry tab categorizes trade data into three distinct viewing modes:
- Date-wise Detail: Displays trades arranged chronologically, providing a sequential view of all transactions.
- Symbol-wise Detail: Groups trades by individual symbols, giving a consolidated view of all activities related to a specific scrip.
- Scrip-wise Summary: Presents a summarized report of all scrips or selected ones in a single entry, offering a high-level overview.
Each of these modes serves specific purposes, catering to traders who wish to analyze their activity from different perspectives. For instance, a date-wise view is ideal for tracking daily performance, while symbol-wise and scrip-wise views are more suited for analyzing specific stocks or assets.
Date-wise Detail
The Date-wise Detail mode in the Trade Registry tab provides a comprehensive chronological view of all trades conducted through your account. It is designed to help traders track their day-to-day trading activities effectively, offering a detailed breakdown of transactions arranged by date.
Overview
The Date-wise Detail mode arranges trades based on the transaction date, allowing users to gain insights into their daily trading performance. Each entry reflects critical trade details such as:
- Transaction Date: The specific date on which the trade occurred.
- Exchange: The exchange (e.g., NSE, NSEFO) where the trade was executed.
- Symbol: The name of the traded security, such as ICICIBANK or NIFTY options.
- Expiry Date: For derivatives, the contract’s expiry date is displayed.
- Buy/Sell Indicator: Indicates whether the trade involved buying (“B”) or selling (“S”).
- No. of Lots: The number of lots traded, relevant for derivatives.
- Quantity: The number of shares or units involved in the trade.
- Rate: The price at which the trade was executed.
- Net Value: The total value of the trade, calculated as Rate × Quantity.
- Order Number: A unique identifier for each order.
- Order Time: The time the order was placed.
Interactive Calendar Heatmap Integration
The calendar heatmap displayed at the top complements the Date-wise Detail mode. By clicking on a specific date in the heatmap, users can directly access the corresponding trade details for that day. For example:
- Selecting a bright yellow square (less than 10 trades) brings up a list of trades conducted on quieter days.
- Clicking on a red square (more than 40 trades) reveals a detailed view of high-activity trading days.
This integration bridges the visual representation of trading patterns with detailed transactional data, offering traders a seamless way to navigate their trade history.
Symbol-wise Detail
The Symbol-wise Detail mode in the Trade Registry tab provides a consolidated view of trades grouped by specific symbols. This mode is particularly useful for traders seeking to analyze their activities related to a specific stock or derivative over a selected period.
Overview
The Symbol-wise Detail mode organizes trade data by individual symbols, grouping all transactions for a specific security. This helps traders identify trading patterns and monitor frequently traded symbols.
For each symbol, the following details are displayed:
- Symbol: Displays the symbol of the traded security (e.g., ICICIBANK or NIFTY options).
- Buy Quantity (B. Qty): The total number of shares or units purchased for the symbol.
- Buy Average (B. Avg): Represents the average price paid for all buy transactions.
- Buy Value (B. Value): The cumulative value of all buy transactions, calculated as Buy Quantity × Buy Average.
- Sell Quantity (S. Qty): The total number of shares or units sold for the symbol.
- Sell Average (S. Avg): The average selling price for the symbol.
- Sell Value (S. Value): The cumulative value of all sell transactions, calculated as Sell Quantity × Sell Average.
- Net Quantity (N. Qty): The net difference between the total buy and sell quantities.
- Net Average (N. Avg): A weighted average price that accounts for both buy and sell transactions.
- Net Value (N. Value): The net monetary value derived after subtracting sell value from buy value, reflecting overall gains or losses for the symbol.
Interactive Calendar Heatmap Integration
The calendar heatmap displayed at the top complements the Date-wise Detail mode.By clicking on a specific date in the heatmap, users can directly access the corresponding trade details for that day.
- Bright Yellow: Less than 10 trades per day.
- Dull Yellow: 10 to 20 trades per day.
- Green: 20 to 30 trades per day.
- Blue: 30 to 40 trades per day.
- Red: More than 40 trades per day.
This integration bridges the visual representation of trading patterns with detailed transactional data, offering traders a seamless way to navigate their trade history.
Scrip-wise Summary
The Scrip-wise Summary mode in the Trade Registry tab consolidates trade details for all selected securities into a single, streamlined view. This mode is ideal for traders who want a high-level summary of their trading activity across multiple securities during a specified time frame.
Overview
The Scrip-wise Summary mode provides a comprehensive summary of all trades grouped by individual securities, offering a quick snapshot of trading activity. This includes buy and sell metrics along with net positions, enabling traders to evaluate performance efficiently.
For each security, the following details are displayed:
- Symbol: Indicates the symbol of the security (e.g., ICICIBANK, NIFTY options).
- Buy Quantity (B. Qty): Total shares or units purchased across all trades for the security.
- Buy Average (B. Avg): Average price of all buy transactions for the security.
- Buy Value (B. Value): Total monetary value of all buy transactions, calculated as Buy Quantity × Buy Average.
- Sell Quantity (S. Qty): Total shares or units sold across all trades for security.
- Sell Average (S. Avg): Average price of all sell transactions for the security.
- Sell Value (S. Value): Total monetary value of all sell transactions, calculated as Sell Quantity × Sell Average.
- Net Quantity (N. Qty): Difference between Buy Quantity and Sell Quantity, representing the overall position for the security.
- Net Average (N. Avg): A weighted average price that accounts for both buy and sell transactions, providing an overall trading price trend.
- Net Value (N. Value): The net monetary value after subtracting Sell Value from Buy Value, indicating overall gains or losses for the security.
Interactive Calendar Heatmap Integration
The calendar heatmap displayed at the top complements the Date-wise Detail mode. By clicking on a specific date in the heatmap, users can directly access the corresponding trade details for that day. For example:
- Selecting a bright yellow square (less than 10 trades) brings up a list of trades conducted on quieter days.
- Clicking on a red square (more than 40 trades) reveals a detailed view of high-activity trading days.
This integration bridges the visual representation of trading patterns with detailed transactional data, offering traders a seamless way to navigate their trade history.
Contract Note
The Contract Note sub-tab in the Reports section provides users access to all contract notes generated for their trades within a specified period. These documents serve as legally recognized confirmations of executed trades, detailing essential transaction information.
Overview
A contract note is an official trade confirmation document issued by the broker, listing all trades executed on a given date. It includes transaction details such as security name, price, quantity, brokerage, charges, and net settlement amount. Users can retrieve contract notes by selecting a date range using the From Date and To Date fields and clicking Submit to fetch contract notes for all trades within the specified timeframe.
Users can choose to view contract notes either at the summary scrip level or detailed trade level using the Summary Contract Note checkbox:
- When selected, contract notes display all trades grouped under each scrip.
- When unselected, each trade execution appears separately for granular tracking.
Additionally, each contract note includes the Daily Margin Statement, summarizing margin utilization and requirements across different segments.
Contract Note Table Breakdown
- Date: Displays the trade execution date.
- Document Name: The system-generated file name for the contract note.
- Type: Indicates the trade category, such as the CASH segment.
- Details: Provides options to View (open the contract note in the browser) or Download (save a copy for record-keeping).
This ensures users can efficiently access, verify, and download trade confirmations while tracking executed orders and margin statements.
Profit and Loss Report
The P&L Report provides a detailed breakdown of a trader’s realized and unrealized profits, total charges, and credits/debits over a selected period. This report helps traders assess their net earnings and expenses across different segments in their trading and Demat account.
Selecting Market Segments
Traders can select the P&L report segment wise by selecting specific market segments:
- Equity – Covers profit and loss from cash market trades.
- Futures & Options (F&O) – Displays P&L for derivative contracts.
- Commodity (COM) – Reports P&L for commodity trading.
Understanding P&L Types
- Absolute P&L: Displays actual profits and losses based on the original buy and sell price. Unrealized P&L is calculated by comparing the previous day’s closing price with the original buy price.
- Indicative P&L: Shows period-wise profits and losses, helping traders assess performance within a specific timeframe. Unrealized P&L is calculated by comparing the previous day’s close with the closing price of the day before the selected From Date.
Breakdown of the Report
-
Profits Section:
-
Realized P&L: The net profit or loss from completed trades, calculated as the difference between the buy and sell prices after accounting for charges.
- Unrealized P&L: Potential profit or loss from open positions, calculated using the closing market price.
- Total Charges: Sum of all costs deducted from the trading account, including brokerage, SEBI charges, STT, GST, and stamp duty.
- Other Credits/Debits: Entries such as refunds, penalties, or incentives applied to the account.
-
Net Realized P&L: Final profit or loss after deducting all applicable charges and adjustments.
-
Charges Section:
This section details all deductions applicable to the trades. Charges incurred during trading directly impact net profitability, and this section provides a transparent breakdown of all applied costs:
- Brokerage Fees: Charges levied by the broker for executing trades.
- Turnover Charges: Fees charged by exchanges based on total traded volume.
- Investor Protection Fund (IPF) Charges: Regulatory charges allocated towards investor protection.
- SEBI Charges: Fees imposed by the Securities and Exchange Board of India.
- Securities Transaction Tax (STT): A tax levied on the value of securities transactions.
- Stamp Duty: State-imposed duty on securities contracts.
-
Goods and Services Tax (GST): Applicable tax on brokerage and other financial services.
-
Trades Section:
Provides trade-specific insights, including:
- Symbol: The traded security.
- Buy/Sell Quantity & Value: Details of purchased and sold units.
- Average Buy/Sell Price: The average price per unit.
- Realized & Unrealized P&L: Profit/loss for each security.
- Previous Close Rate: Last closing price for reference.
Verified P&L
Traders can share their P&L report via a public link by selecting:
- Segment to Share (Equity, F&O, Currency, or Commodity).
- Summary or Detailed View.
- Name display (Full or Masked).
- Custom Date Range.
Click Generate to create a shareable link, which can be copied or shared directly via WhatsApp, Telegram, Email, and LinkedIn.
Tax P&L Report
The Tax P&L Report is an essential tool designed to help traders efficiently compute their profits and losses for income tax filing. This report categorizes earnings into Intraday, Short-Term, and Long-Term segments, ensuring accurate tax calculations based on trading activity.
Generating the Tax P&L Report
To generate the report:
- Select the Financial Year for which the tax report is needed.
- Choose the Trading Segment (Equity, F&O, CDS, or Commodity).
- Click Submit to view the detailed breakdown of realized profits and losses, associated charges, and other credits/debits.
Breakdown of the Report
-
Trades Section:
This section provides a categorized summary of executed trades:
- Intraday Trades: Transactions where both buy and sell occur within the same trading session.
- Short-Term Trades: Trades where securities are held for less than a year before being sold.
- Long-Term Trades: Trades where securities are held for more than a year before being sold.
Each category displays:
- Buy & Sell Quantity: The number of units bought and sold.
- Average Buy & Sell Price: The average price per unit at the time of purchase or sale.
- Total Buy & Sell Value: The total transaction value based on executed quantities.
- Realized P&L: The profit or loss incurred after selling the securities.
-
Charges Section:
This section lists all trading-related expenses that impact net P&L. It includes:
- Brokerage Fees: Charges applied per executed order.
- Turnover Charges: Exchange fees based on total traded volume.
- SEBI Charges: Fees levied by the Securities and Exchange Board of India.
- Securities Transaction Tax (STT): A government-imposed tax on securities trading.
- Stamp Duty: State-imposed duty on trade transactions.
- Goods and Services Tax (GST): Tax applicable on brokerage and other services.
- Cess (SBC+KKC): Additional government levies, if applicable.
-
Other Credits/Debits Section:
This section lists any additional charges or refunds that impact the total tax liability:
- Call & Trade Charges: Additional fees for orders placed via phone.
- Payment Gateway Charges: Charges applied for online fund transfers.
- DP Charges: Fees related to Depository Participant services.
- Other Credits/Debits: Displays non-trade financial adjustments recorded in the ledger, including penalties, delayed payment charges.
This report simplifies tax compliance by structuring trade activity into clear categories, making it easier for traders to declare their earnings while filing their income tax returns.
Global Report
The Global Report provides a comprehensive summary of your annual financial transactions with Tradejini. This report consolidates receipts, payments, and holdings across various trading segments, offering a holistic view of your financial activity over a selected financial year.
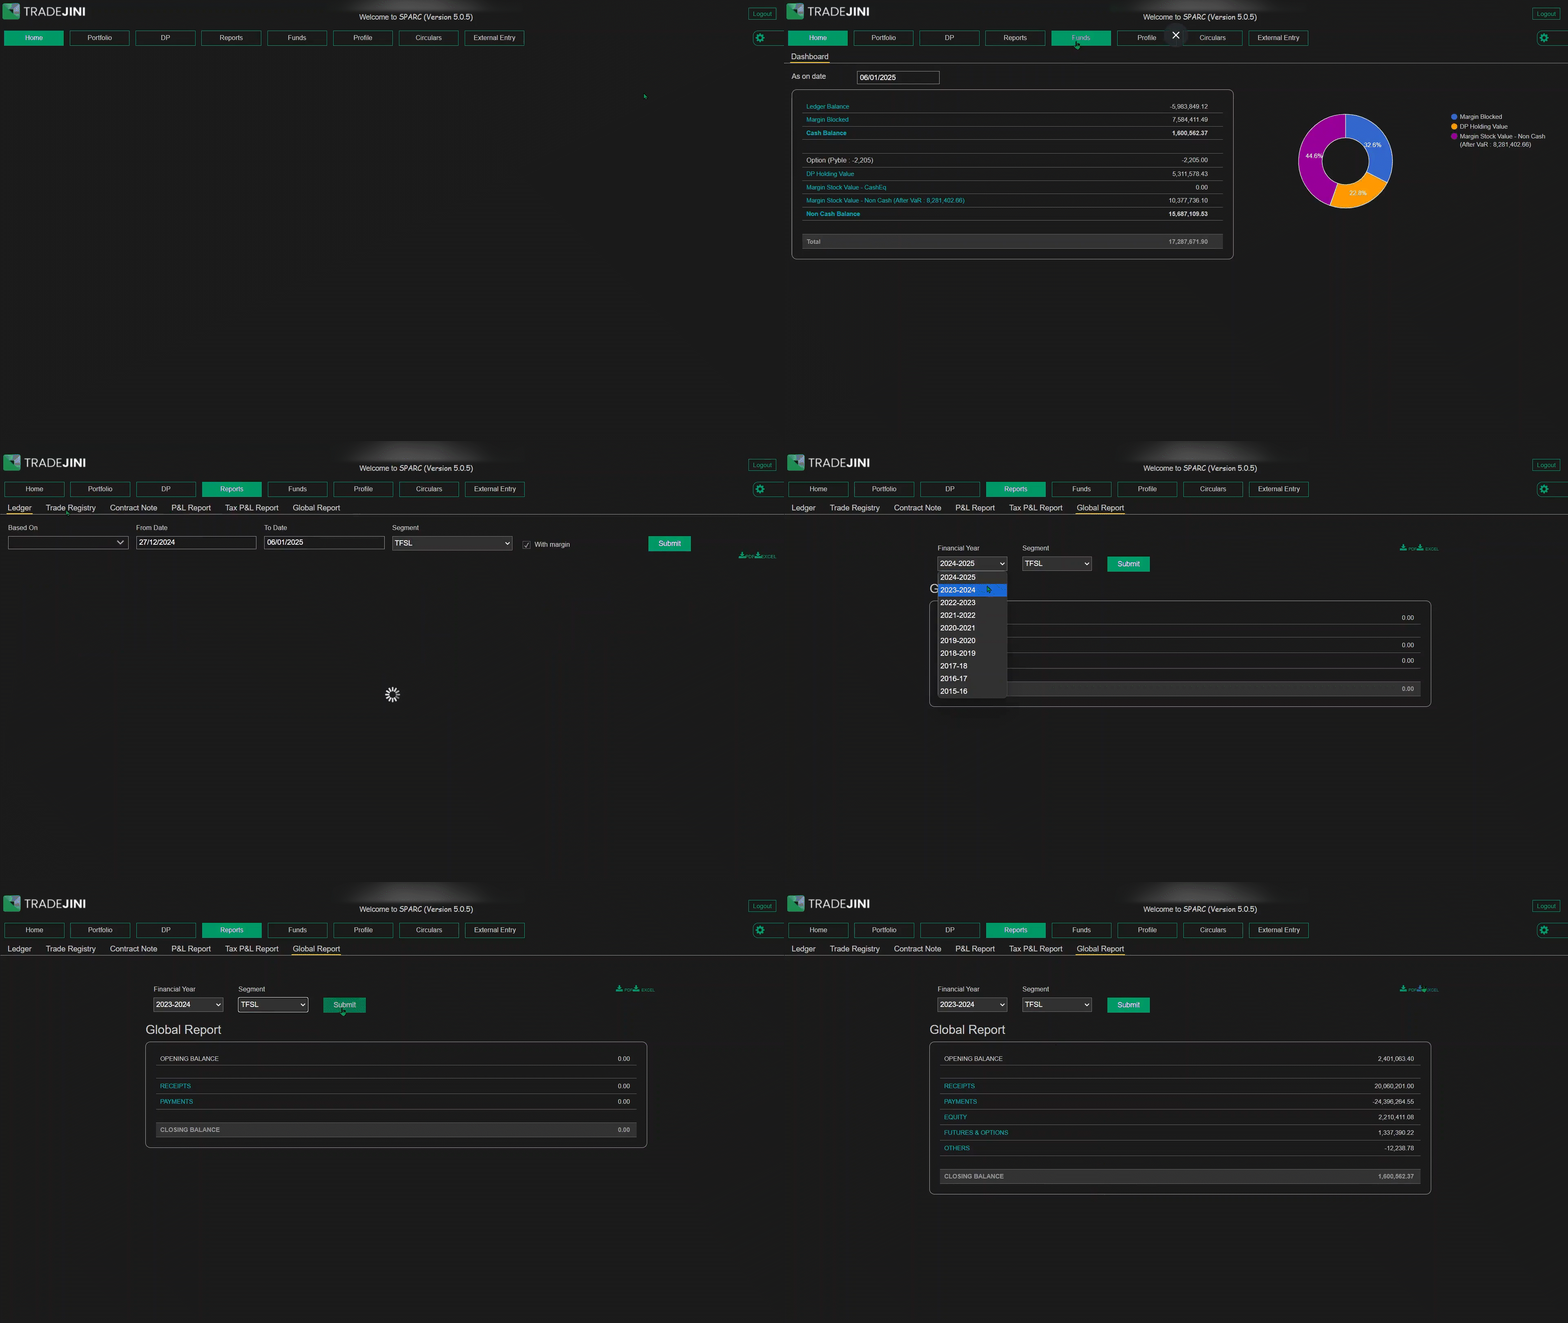
Generating the Global Report
To generate the report:
- Select the Financial Year for which you want to review your financial summary.
- Click Submit to generate and display the report.
Breakdown of the Report
Once generated, the report displays the following key financial categories:
- Opening Balance: The starting balance for the selected financial year.
- Receipts: Total funds received during the period.
- Payments: Total amount paid or withdrawn from the account.
- Equity Holdings Value: The valuation of your stock holdings.
- Futures & Options (F&O) Values: The financial details of your F&O positions.
- Others: Any additional transactions or miscellaneous financial adjustments.
- Closing Balance: The final balance after all receipts and payments are accounted for.
Each of these categories serves as a hyperlink, allowing you to access detailed breakdowns for each financial section. This feature enables users to drill down into specific transactions, ensuring complete transparency and deeper insights into their trading activities.
Exporting the Global Report
Users can download the Global Report in PDF or Excel format for offline access, aiding financial planning and tax filing.
This report provides a structured view of transactions, helping traders track cash flows and analyze annual trading performance.