Home
Overview (Web)
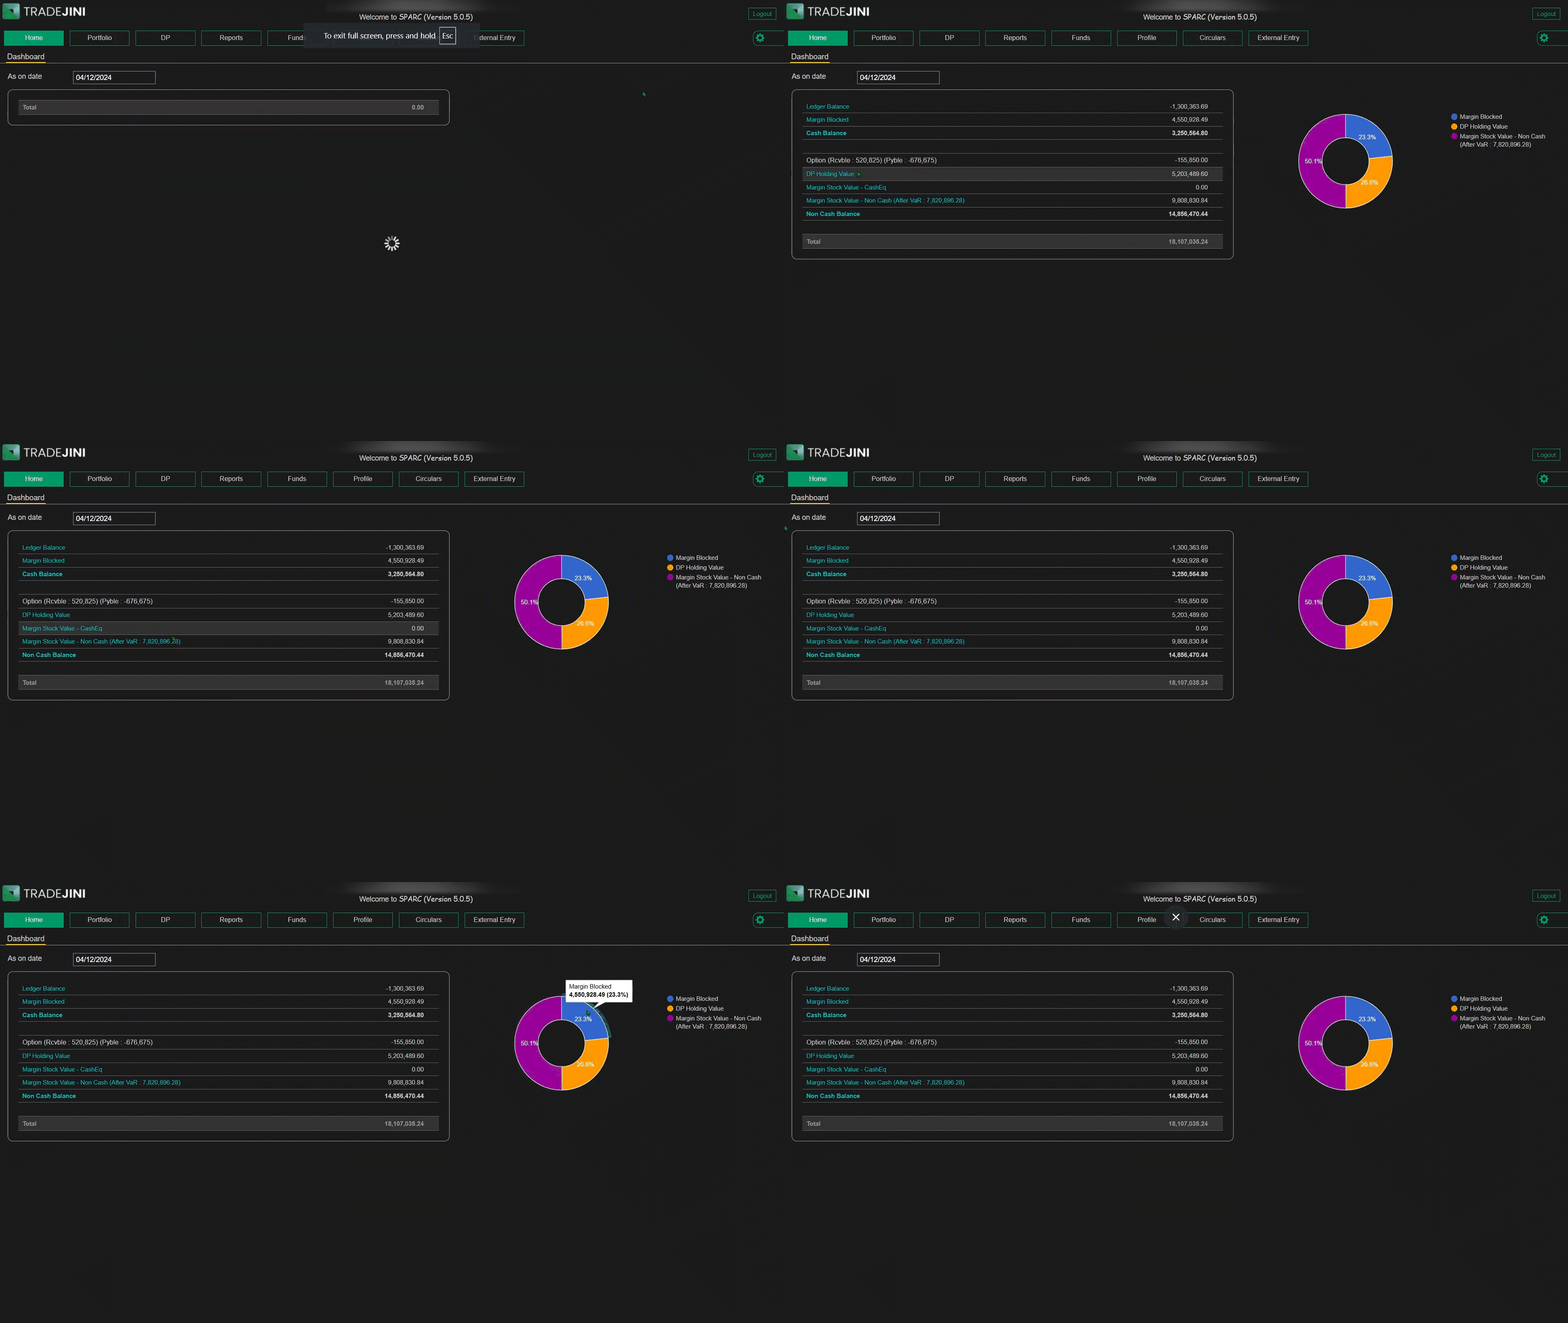
The Home Tab in the Tradejini Hive serves as the central dashboard, providing a comprehensive overview of key financial data as of the selected date. It offers users a detailed table and a pie chart for easy analysis, helping them assess their account status effectively.

Dashboard
1. Account Status
This table outlines key account status metrics, including:
- Ledger Balance: Displays the total ledger balance in your account.
- Cash Balance: Shows the cash available for immediate use.
- Options Balance: Represents receivables and payables from options positions.
- DP Holding Value: Displays the value of stocks held in your Demat account.
- Margin Stock Value (Cash Equivalent): The value of pledged stocks considered as cash equivalent.
- Margin Stock Value (Non-Cash): The value of pledged stocks considered as non-cash.
- Non-Cash Balance: Summarizes the total non-cash value of holdings.
- Total Balance: The sum of all balances, providing the overall account value.
2. Pie Chart
A pie chart is displayed alongside the table, offering a visual breakdown of key account balances:
- Blue: Margin Blocked
- Red: Option (receivable and payable)
- Orange: DP Holding Value
- Purple: Margin Stock Value (Non-Cash)
- Yellow: Other account metrics (as applicable)