Portfolio
Overview (Web)
The Portfolio Tab in the Tradejini Hive provides users with a complete view of their equity holdings and open positions across various segments. It enables quick access to detailed breakdowns of each trade or investment, showing key figures related to your current positions and holdings.
Portfolio Categories
-
Cash: Displays your cash equity holdings.
-
Equity Derivative: Highlights your open positions in equity derivatives.
-
Currency Derivative: Shows your open positions in the currency derivatives segment.
-
Commodity Derivative: Lists your positions in commodity derivatives.
-
External Entry: Includes trades or holdings manually added from external sources.
-
Margin Pledge: Details securities pledged as collateral for margins.
-
Corporate Action: A request tab provided to offer your shares for buyback announced by the company whose shares you are holding.
Download Options
Users can download information from any of these sub-tabs by clicking the PDF or Excel button.
Cash
The Cash tab in the Portfolio section displays all equity holdings, helping traders keep track of their current listed holdings and assess their market exposure. By selecting an "As on Date," traders can review how their portfolio stood at any specific time. Sorting options allow users to quickly analyze key metrics like quantity, buy value, or unrealized P&L. Additionally, clicking on individual scrip will provide insights into the break-up of your holding with transaction date wise details.
Users can choose to view their holdings in two different modes:
- Summary Mode: Holdings are represented under one menu.
- Detail Mode: Holdings are divided into multiple sub-menus
Summary Mode
In Summary Mode, the Cash tab provides an at-a-glance view of all equity holdings under a single menu, allowing traders to quickly assess their overall portfolio without needing to navigate sub-menus. Holdings are displayed in a tabular format with the following columns
-
Security Name: Shows the name of the equity or stock held by the trader, helping them quickly identify specific securities in their portfolio.
-
ISIN: A globally recognized 12-character code that uniquely identifies each security. This ensures that traders can distinguish between similar securities listed across different exchanges.
-
Unsettled Qty: Displays the number of shares that have been traded but are yet to be settled. This helps traders understand the pending deliveries in their portfolio.
-
DP Qty: Represents the number of shares available in the trader’s Demat account. These shares are fully settled and available for trading or pledging.
-
Ben Qty (Beneficial Quantity): The total quantity of shares that the trader holds beneficial ownership of, including both settled and unsettled shares.
-
MBen Qty (Margin Beneficial Quantity): Shows the number of shares that are pledged and eligible for margin benefits. This helps traders determine how much margin they can utilize from their holdings.
-
Net Qty: Displays the net quantity of shares held after accounting for unsettled trades. This provides a clear picture of the trader’s net position in each security.
-
Avg (Average Price): Indicates the average buying price per share, calculated using the FIFO method. This helps traders evaluate their average cost and assess unrealized profits or losses.
-
Closing Rate: Shows the closing price of the security on the selected date. This is crucial for traders to monitor current market prices and compare them with their buy average.
Detail Mode
Breaks holdings into sub-menus for a more detailed breakdown.
- Unsettled Holding: Lists all your buying which are yet to be settled
- DP Holding: Lists your free holding which are traded in the market
- Margin Holding (CASH): Lists all your cash equivalent pledged securities
- Margin Holding (Non CASH): Lists all your non-cash pledged securities
Holdings are displayed in a tabular format with the following columns:
-
Security Name: This column displays the name of the security or stock held in the trader’s portfolio. It helps users quickly identify the specific shares they own and track performance for individual stocks.
-
ISIN: The International Securities Identification Number (ISIN) is a unique 12-character alphanumeric code that identifies a specific security. This globally recognized code ensures that traders can accurately distinguish between similar securities listed across different exchanges.
-
Qty (Quantity): This column shows the number of shares held for each security. It represents the total quantity owned by the trader as of the selected date. Tracking quantity is essential for traders to understand their market exposure and position size.
-
Buy Avg: The buy average price per share is displayed here. It is calculated using the FIFO method (First In, First Out), meaning the shares bought first are considered sold first when determining the average cost. Understanding the buy average helps traders assess their profit or loss more accurately.
-
Example: If you buy 100 shares at ₹50 and another 100 at ₹60, selling 100 shares will use the ₹50 batch first. The remaining shares will have a buy average of ₹60.
-
Buy Value: This column indicates the total value spent to acquire the shares. It is calculated as the product of the quantity and the buy average price. Knowing the buy value helps traders evaluate their investment cost and compare it with the current market value.
-
Closing Rate: The closing rate represents the last traded price of the security on the selected date. This value is crucial for traders to gauge the current market price of their holdings.
-
Total Value: This column displays the total market value of the trader’s holdings. It is calculated by multiplying the quantity of shares by the closing rate. Monitoring total value helps traders understand the worth of their portfolio at a glance.
-
Unrealized P&L: Unrealized profit or loss is shown in this column. It is the difference between the total market value and the buy value of the holdings. A positive value indicates a profit, while a negative value represents a loss. This metric is essential for traders to track potential gains or losses before they actually sell their holdings.
Equity Derivative
The Equity Derivative tab in the Portfolio section displays all open positions in equity derivatives, including both Futures and Options contracts. This tab helps traders monitor and manage their trades in equity derivative contracts. Additionally, index derivative positions, such as NIFTY or BANKNIFTY futures and options, are also displayed here under Equity Derivatives to provide a consolidated view of all equity-related derivative positions. This tab shows key details of each derivative position, such as expiry dates, open lots, and unrealized profit or loss. Traders can also check their positions for a specific date by selecting an "As on Date" and clicking Submit.
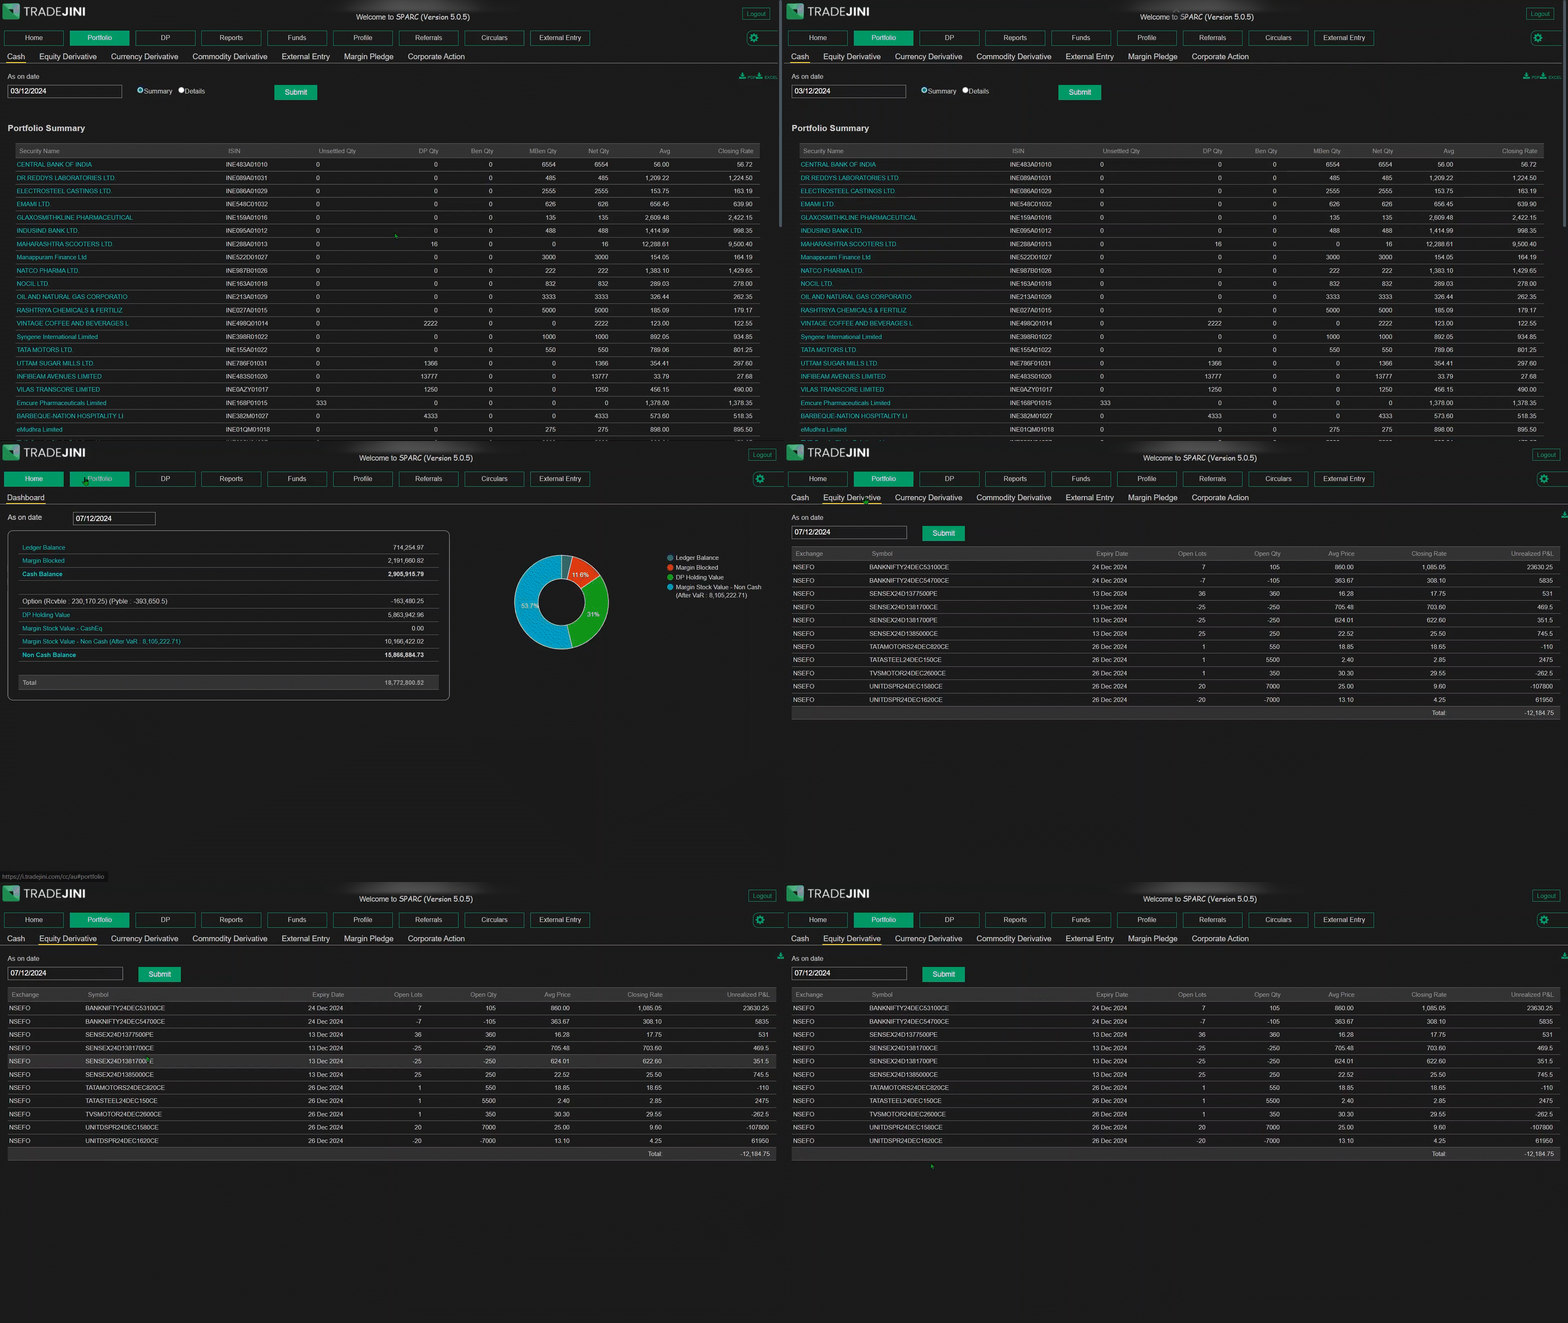
Column Details in Equity Derivative Table
-
Exchange: This column indicates the exchange where the derivative contract is traded, such as NSEFO (NSE Futures and Options).
-
Symbol: Displays the derivative contract symbol in the format used by the exchange.
-
For example, symbols for NIFTY options may appear as NIFTY25JAN23700CE (representing a NIFTY call option with a strike price of 23700 expiring on 25th January), while stock options may follow a similar format with stock-specific tickers.
-
Expiry Date: Shows the expiration date of the derivative contract. This is essential for traders to know when the contract will be settled or expire.
-
Open Lots: Indicates the number of lots currently open in the trader’s position. Each lot represents a fixed number of shares as specified by the exchange.
-
Open Qty: Displays the total quantity of shares in the open position, calculated as the product of open lots and the lot size.
-
Avg Price: Represents the average entry price of the derivative position. Understanding the average price helps traders evaluate their entry level and compare it with the current market price.
-
Closing Rate: Shows the last traded price of the derivative contract as of the selected date. This helps traders gauge the current value of their open positions.
-
Unrealized P&L: Indicates the unrealized profit or loss of the open derivative position. A positive value reflects a profit, while a negative value shows a loss.
Download Options
Traders can download their equity derivative positions by clicking the Excel button available on the page.
Commodity Derivative
The Commodity Derivative section under the Portfolio tab provides a complete overview of positions in commodity futures and options. This section is crucial for traders engaging in commodity markets, helping them track their exposure to derivatives of various commodities like gold, silver, crude oil etc.,. It displays essential details such as expiry dates, open lots, average prices, and unrealized profit or loss, assisting traders in managing positions efficiently.
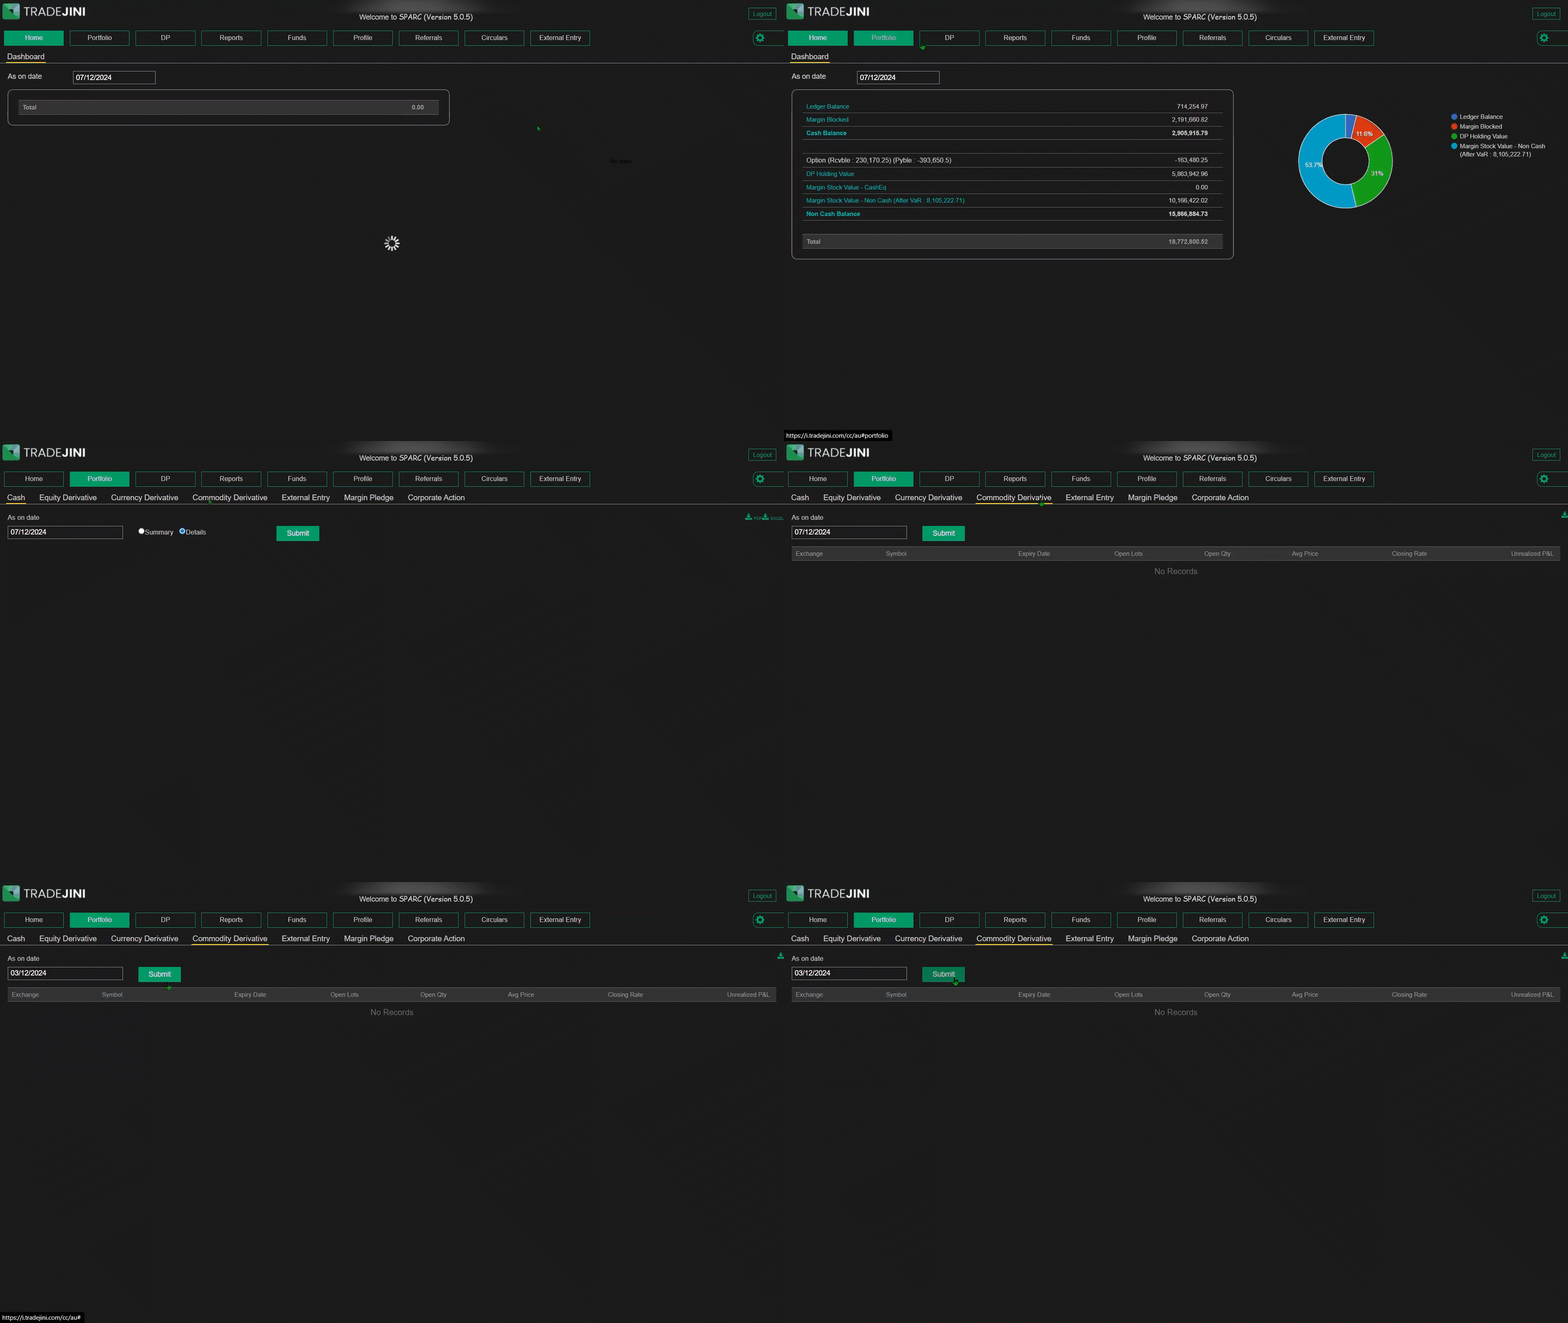
Overview of Table Columns
-
Exchange: Displays the exchange where the commodity derivative is traded, typically MCX (Multi Commodity Exchange).
-
Symbol: Represents the specific commodity contract being traded. For example, a Goldpetal futures contract expiring in January may appear as GOLDPETAL31JANFUT.
-
Expiry Date: Indicates the date on which the commodity derivative contract expires. This helps traders prepare their exit or rollover strategies before the expiry.
-
Open Lots: Displays the total number of lots currently open in the trader’s position. Each lot corresponds to a predefined quantity of the commodity.
-
Open Qty: Shows the cumulative quantity of the commodity in open positions, derived by multiplying the open lots by the standard lot size.
-
Avg Price: Represents the weighted average price at which the commodity contracts were bought or sold. This information helps traders assess whether their current position is profitable.
-
Closing Rate: Displays the last traded price of the commodity contract as of the selected date. Monitoring this helps traders stay updated on market fluctuations.
-
Unrealized P&L: Shows the profit or loss on open positions, calculated based on the difference between the average price and the closing rate. A positive figure indicates a profit, while a negative figure signifies a loss.
Note:
Tradejini offers commodity derivative trading exclusively on MCX, covering popular commodities such as gold, silver, crude oil, and does not offer agricultural products. Commodity futures contracts can either be cash-settled or auto-squared off if not closed before the delivery period. In-the-money (ITM) commodity options are automatically converted into futures contracts upon expiry, provided there is sufficient margin; otherwise, positions are squared off by RMS team.
External Entry
The External Entry section under the Portfolio tab is designed to help users manually record and manage trades or holdings that were executed outside the Tradejini platform. This feature ensures that all investment transactions are accurately logged, even if they weren't captured automatically. Traders can use this section to input trades from IPOs, corporate actions, or any other external investments, keeping their portfolio records complete and up-to-date.
Post External Trades
This section allows users to manually add external trades. The input fields include:
-
Symbol: Enter the stock or instrument symbol manually or search using the lookup option.
-
Tran Date: The transaction date of the trade.
-
Type: Select the type of external trade from the dropdown list (e.g. Bonus).
-
Buy/Sell: Choose the action taken—either Buy or Sell.
-
Quantity: Specify the number of shares or units involved in the trade.
-
Rate: Enter the price per unit at which the trade was executed.
Once the necessary details are entered, clicking the Add button records the trade in the system.
External Holdings
This section displays a list of all manually entered external trades. The table columns include:
-
Symbol: The name of the stock or instrument for which the trade was recorded.
-
Tran Date: The date on which the transaction took place.
-
Type: Indicates the type of external entry, such as IPO, Bonus, or Rights Issue.
-
Buy/Sell: Specifies whether the trade was a purchase or a sale.
-
Quantity: The number of shares or units involved in the trade.
-
Rate: The price per unit at which the transaction was executed.
Users can filter external holdings by date range using the From Date and To Date fields, followed by clicking the View button.
Note
- Once a trade is added to the External Holdings section, it cannot be modified. Ensure all details are accurate before clicking the Add button.
- The External Entry feature helps in maintaining comprehensive records for accurate portfolio tracking and reporting, especially when dealing with IPO allotments or corporate actions.
- Traders can use this feature to consolidate all their holdings in one place, making it easier to assess their overall portfolio performance.
Margin Pledge
The Margin Pledge section under the Portfolio tab enables traders to pledge their securities as collateral to increase their margin available for trading. This feature allows users to leverage their existing holdings and enhance margin for trading purposes. The section includes three key options: Pledge, Unpledge, and History, each serving a specific purpose in the collateral management process.
Pledge
The Pledge section allows users to pledge securities approved by the exchanges to avail collateral margins for trading. The process involves:
- Exchange: Select the preferred exchange (NSE or BSE).
- Segment: Choose the market segment—Equity, Currency, or Commodity.
- View Button: Displays eligible securities available for pledging.
- Security: The list shows securities with their unique ISIN.
- Closing Rate: The previous day’s closing price of the stock.
- VAR %: Indicates the haircut percentage applied by the exchange.
- Available Qty: The quantity of the security available in the demat account for pledging.
- Request Qty: Enter the number of shares you wish to pledge.
- Margin Benefit: Displays the estimated margin benefit after pledging.
Click Pledge after filling in the details. An OTP-based authentication via CDSL will be required to complete the pledge request.
Unpledge
The Unpledge section allows users to release pledged securities back to their demat account. The process involves:
- Exchange: Select the exchange where the security is pledged.
- View Button: Displays the list of pledged securities along with their pledged quantity.
- Security: Shows the list of pledged securities, including ETFs and government securities, with their ISIN.
- Pledged Qty: Displays the total number of units currently pledged.
- Release Qty: Enter the quantity you wish to unpledge.
Click Save after entering the release quantity to confirm the request.
Note: Unpledge requests placed before 4:00 PM on a working day will be processed on the same day.
History
The History tab provides a comprehensive log of all pledging and unpledging activities, including:
- Tran Date: The date when the pledge or unpledge transaction was executed.
- Security: The name and ISIN of the pledged/unpledged security.
- Remarks: Displays the transaction type, such as 'Pledge Creation' or 'Pledge Release', along with the PSN (Pledge Sequence Number).
- Quantity: Shows the number of securities pledged or unpledged.
- Status: Confirms whether the transaction is successful or pending.
Additional Information
- Eligible Securities: Only stocks, ETFs, and mutual funds listed in the NSE-approved securities list can be pledged.
- Collateral Usage: The collateral margin can be utilized for equity intraday trading, Future positions, and option writing. However, exchanges mandate that at least 50% of the margin for F&O positions must be in cash or cash-equivalent collateral.
- Charges: Pledging or unpledging requests are subject to a fee of ₹32 + GST per request.
Corporate Action
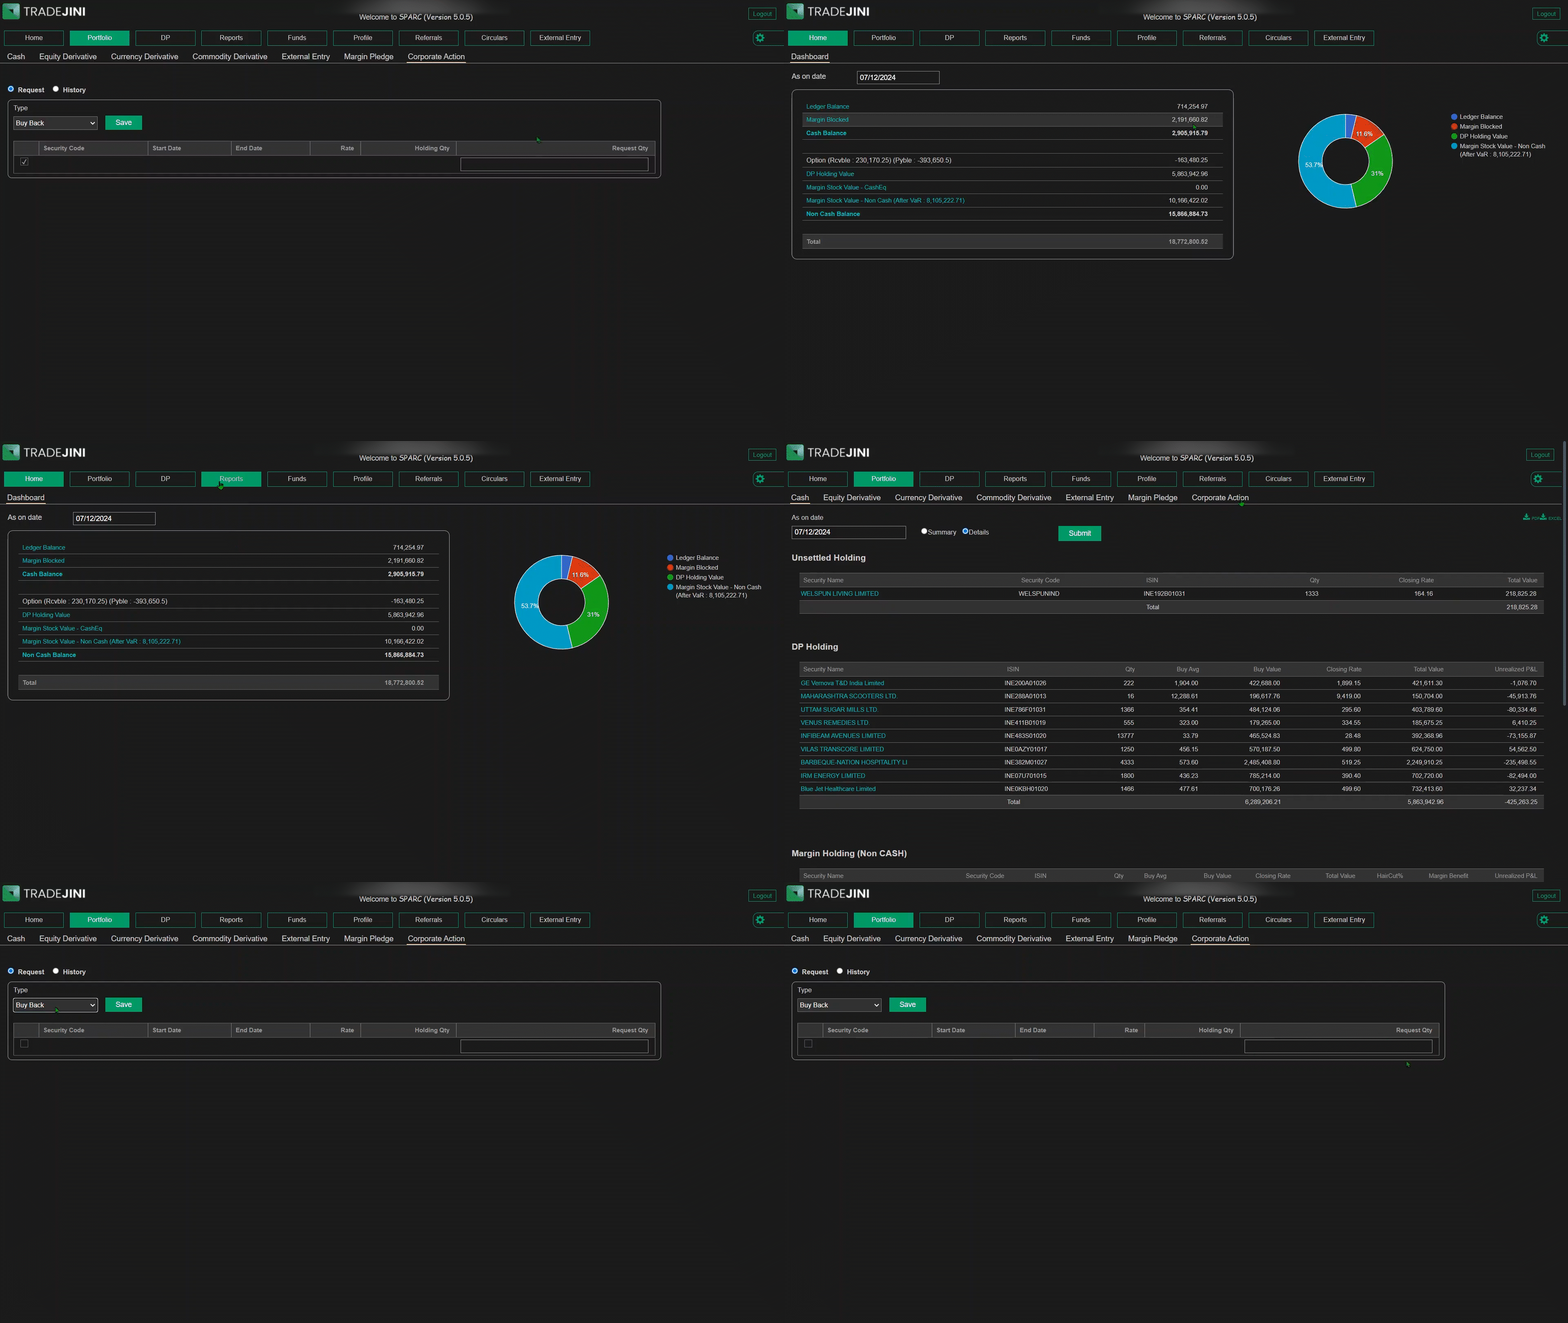
The Corporate Action Tab in the portfolio section allows clients to participate in buybacks offered by companies on their existing holdings.
Applying for Buybacks
-
Purpose: This tab is designed exclusively for submitting requests to participate in company buyback offers. Clients with eligible holdings can directly apply from this section.
-
Request Submission:
- Select the company offering the buyback from the available list.
- Enter the desired quantity of shares you wish to tender for the buyback.
- Submit the request for processing.
Viewing Request and History
-
Request Tab
-
Displays ongoing buyback requests where users can view and manage submissions.
-
History Tab:
- Provides a summary of past buyback requests, including details such as:
- Security Code: The identifier of the security.
- Request Date: The date when the request was made.
- Request Quantity: Number of shares submitted for the buyback.
- Approved Quantity: Number of shares approved by the company for buyback.
- Status: Current status of the request (e.g., Processing, Completed).
- Approved Date: The date when the request was approved.
Steps to Apply for Buybacks
- Navigate to the Corporate Action Tab under the portfolio section.
- Identify the company offering the buyback.
- Enter the number of shares you want to offer for buy back.
- Confirm and submit the request.
Important Notes:
- Ensure that the holdings being tendered meet the eligibility criteria specified by the company.
- Once a buyback request is placed, it will reflect under the History tab for future reference.